Voronoi Diagrams - Analysing Tactics with Graphics
What is a Voronoi Diagram
There are several ways to visualise the game of football, one of these approaches is a Voronoi Diagram. Voronoi Diagrams are one of the most useful visualisations when trying to demonstrate pitch control, they excel at demonstrating the spacial value each player has within a game. In essence, a Voronoi will draw a collection of lines equidistant between two points (two players in this case) . Once drawn, this will create small pockets of area which show the spaces that each player is in control of and therefore we can conduct an analysis on that player’s effectiveness and additionally a team’s effectiveness to cover space overall.
This article by Ricardo Tavares is an excellent introduction to Voronoi diagrams and their application within football- https://medium.com/football-crunching/using-voronoi-diagrams-in-football-ca730ea81c05.
How to Analyse a Voronoi Diagram :
We can use Voronoi diagrams in two ways to analyse games of football. The most common way is analysing on a per-chance basis.
An example of this is when Forbes’ Data Scientist Vivekpandian used a Voronoi to investigate Sadio Mane’s goal vs Chelsea FC. The video allowed a simpler way to understand how Liverpool generated overloads, broke the defensive line and created space for Mane’s shot. - https://www.linkedin.com/posts/vivekpandian8_pitchcontrol-datascience-chelsea-activity-6668185008932560897-kCT-/?trk=public_profile_like_view
In the video, we see Liverpool generate a 4v2 overload on the left wing, this allows The Reds to combine in close quarters with a collection of short passes and progress the ball forward beyond the midfield line to Mane. The Senegalese winger is now in enough space to pick out Firmino who has run behind the defensive line. From here Mane controls his space and capitalises on a disorganised defence to receive within the penalty area and convert the chance.
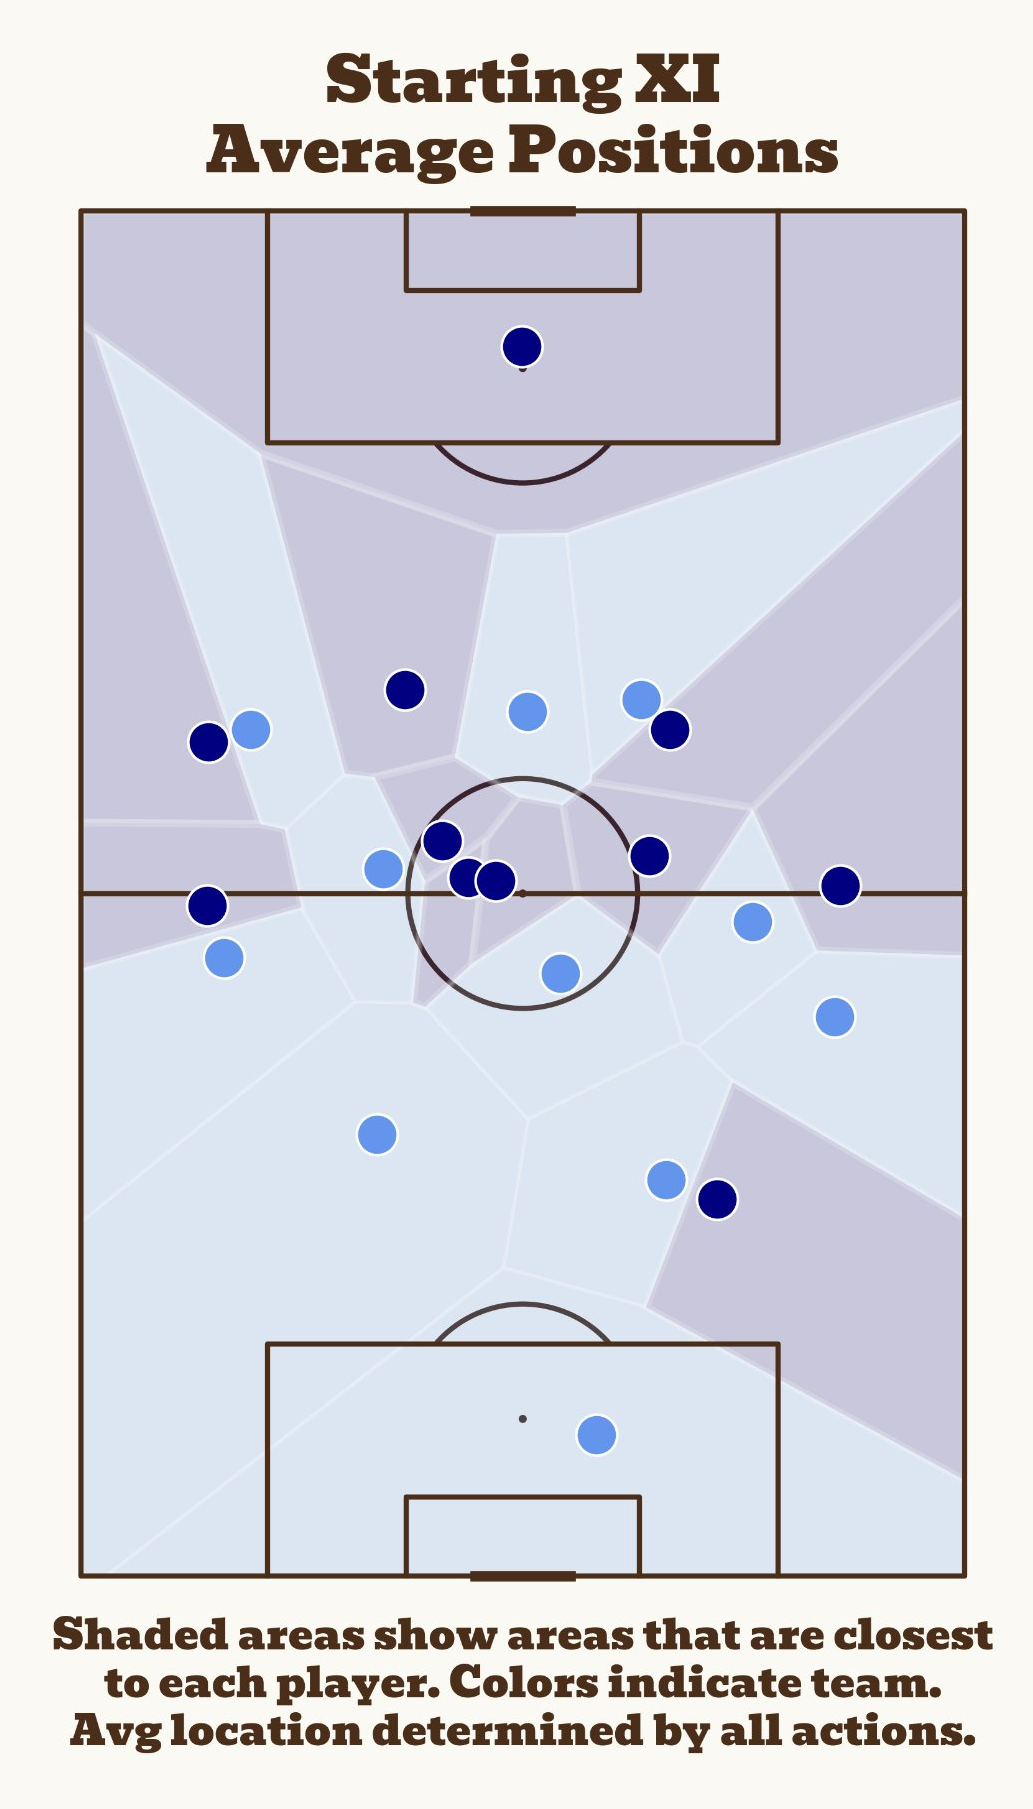
The alternative way Voronoi Diagrams are used to analyse football matches is by measuring on a match-by-match basis. I must give credit here to Ben Griffis on Twitter @BeGriffis who regularly posts these graphics and was the first place I saw the diagrams used in this way. Here we can see his graphic from the 2022 World Cup Final
How to Analyse a Voronoi Diagram
As shown in the footer, a voronoi can also show the average position of all starting players' actions. We can now see the formation that a team set up in, who controlled certain spaces and where overloads and space came from.
Analysing a Voronoi in this way is very game-specific, however, I have pulled out a few things you can look for:
Team Formation
When looking at Voronois we can see how teams are set up in possession, this allows us to make comparisons between teams and also investigate more advanced concepts such as positional play.
Overloads
When we compare the two team structures we can start to see the tactical plans by managers. if we isolate areas of the pitch we can see where managers try creating overloads and how managers have moved players from their usual positions to deal with the opposition.
Space in the opposition half
In most situations, if a team can consistently find space in the opposition’s half then they are going to be able to maintain possession, generate threat and create chances.
Defensive Line Heights
How high a defensive line is can show two major things, firstly we see a team’s defensive tactics. If they are playing an offside trap for instance. Alternatively, we can see how much possession a team has, teams who hold possession will be higher up the pitch.
Voronoi Defence Breaks
One of the first things that I look for to judge how a game is played is to see the number and severity of breaks in an attacking line caused by an attacker that a team has. Teams that have vornoi shards that interrupt the defensive line then they will have been able to create chances through that player. Obviously, if there are multiple shards then the team has been offensively threatening and if they have conceded multiple this would suggest they are lacking defensive solidity.
Argentina Vs France:
Worldwide the World Cup Final was watched by billions of people, though the number of people who understood that game is far smaller. This is where we can use a Voronoi to break down the game and understand tactically what happened in the best game that the game has ever seen.
The broadest thing we can see is the positional set-up of both squads. In possession, Argentina set up in a 4-3-3, defensively the full-backs progressed forwards, within the midfield the central centre-midfielder holds a position slightly deeper as a defensive midfielder with two higher number 8s. The number 8s push wider to evacuate the stereotypical attacking midfielder position on the field. Offensively, we see Messi coming inside from the right wing to try to find space whilst Di Maria maintains the width on the left side pining the French full-back to their defensive line.
On the opposing side, France set up in a 4-4-1-1. Starting from the front, we can see the extreme outlier of Mbappe on the left wing, completely alienated from his team structure. This was due to a combination of his low defensive work rate to retreat into deeper positions and a constant attempt to get in behind the South American defence. Further analysis of the French attack shows a significant lack of a central focal point, we can see Giroud was asked to come short for the ball to his feet in deeper, midfield areas. Tactically, this failed Giroud doesn’t add spacial value in the deeper areas within the centre of the field and cramps the space of their main creator Antoine Griezzemann. We can see how the focal point is shifted out wide to the outlier Mbappe, his position being more central than a traditional winger to place himself in more dangerous positions,
Examining deeper, Argentina’s game plan tried to create overloads in the wide areas by pushing their centre-mids into areas to collaborate with the wingers and fullbacks. On the left, we see this traps the French players against the wing and generates a 3v2. On the right wing, a few things accumulate to an Argentian overload; to start with Mbappe’s unwillingness to track back leaves space for the Argentinian right back Molina to advance into, this combines with Messi drifting inside preoccupying the centre back so that when Argentina push the central midfielder wider it creates the 2v1 out on the right wing.
Defensively, the World Champion’s midfield proved solid. We can see France’s struggles to progress through the midfield, apart from Mbappe there is no player higher than the Argentinian midfield. It is difficult still to see how Mbappe can receive the ball to his feet, the space is almost zero. France had minimal space within the opposition’s half, the ball forward has to be a long ball in behind to find Mbappe. This was still too great a risk for La Albiceleste, dropping their back-line deep as we can see and having a really low defensive line to try to reduce the space available behind them and minimise the risk of the ball into there. Argentina, on the contrary, scythe through the French backline in three distinct places illustrating how Argentina had an attacking threat throughout the match and will have been able to create more frequent, varied chances in open play.
We can match up the conclusions we have drawn from the Voronoi with Stats-Perform data to prove the effectiveness of our analysis. In open play Argentina comfortably out-created France throughout the 120 minutes creating 2.48xG compared to 0.48xG, this reflects the hypothesis that the Voronoi defence breaks created by Argentina demonstrated an attacking threat. The Europeans’ difficulty to play in Argentina’s half is exposed statistically too, France completing 176 passes outside of their own half, only three-quarters of their opposition 221. To conclude the attempts to play the long out-ball towards Mbappe on the left wing resonate within the numbers Argentina completed 28 long passes compared to France’s increased number of 38.
Summary
In conclusion, we can see how using Voronois can enhance your analysis of a game when magnifying into one situation and understanding how chances are created whilst also being able to show tactical intentions and habits from within a game!

